
Planable Analytics brings every connected page into one dashboard — organic and paid side by side, across all your channels or one at a time.
→ Supported platforms and account types
→ Organic vs paid, explained
→ Cross-channel Analytics
→ Single-channel Analytics
→ Numbers that look odd but are correct
→ AI visibility
→ Competitor analytics
→ Creating reports
→ Pricing
Planable Analytics is built for teams managing several social accounts at once — agencies running client pages, brands with multiple locations, or anyone overseeing franchise social media. Every essential metric sits in one dashboard, and where you run ads, your results are broken out into what your content earned organically and what your budget bought.
Supported platforms and account types
Here are all the platforms and account types supported by Planable Analytics:
To access Analytics, you'll need an active paid subscription. Go to your Workspace sidebar and select the Analytics tab.
Organic vs paid, explained
On Facebook, Instagram, LinkedIn and TikTok, Analytics separates what your content earned on its own from what your ad budget bought — at page level, on individual posts, and in your reports. Three words do most of the work:
- Organic — a post you published with no ad money behind it.
- Boosted — a post you published organically and then put budget behind. It has an organic half and a paid half. In the Content table it carries a Boosted tag and expands into From organic and From paid rows.
- Paid, or advertised — ads that never went out on your page as a normal post, often called dark posts. You won't find them in your content calendar. They live in a separate Ads table.
In the charts, the toggle reads Both / Organic / Paid. "Paid" there means every ad-driven result — boosted posts and dark posts together. That matches how the platforms report it themselves; LinkedIn, for example, calls the whole lot "Sponsored".
Good to know: the organic vs paid breakdown appears in the single-channel Analytics view only. In cross-channel view, your numbers stay blended — switch to a single page to see the split.
Connecting an ad account
Paid data needs an ad account. Connecting the page or profile isn't enough — page analytics and ads analytics come from two different places, and Planable needs permission to both.
Until you connect one, Analytics shows a Connect your Ad account card in the row of metric cards at the top, sitting in the slot where Ad spend will live. Hover it for a short explainer, or dismiss it with the X. If you already have an ad account connected, you won't see the card at all — your paid data syncs on its own.
You can connect more than one ad account per page. A dropdown next to the date picker switches between All ad accounts and a single one.
For the full walkthrough, see How to connect an ad account.
Good to know: on Facebook and Instagram, one Meta Ads Account connection serves both Analytics and Social Inbox. Connect it once, from either place, and you get paid metrics in Analytics and comments on your ads in the inbox.
What you'll see once you're connected
- An Ad spend card joins the metric cards at the top.
- Charts gain the Both / Organic / Paid toggle. On Both, bars stack in two colours with an Organic / Paid legend.
- Recent days are drawn as hatched Incomplete data bars. Platforms report ad data with a lag, so judge trends on data that's at least a few days old.
- The Content table shows your own posts, with a Boosted tag and an expander on the promoted ones.
- A second Ads table lists your advertised content. Those rows aren't clickable — there's no Planable post behind them to open.
- Cost metrics — Spend, CPM, CPC and CPE — appear wherever spend does. They only ever apply to boosted and paid content, never organic.
What splits on each platform
How much of the split you get depends on what each platform's API gives us. Here's where it lands:
What doesn't split, and why
- Facebook — follower gains, engagement, and page views show a total only. Meta's API doesn't provide a breakdown for them.
- Instagram — followers and engagement at page level aren't splittable. And Instagram's standard per-post metrics are organic-only by Meta's design, so Planable works the paid slice out from Meta's total per-post figures. That's why Instagram post data is less granular than Facebook's.
- LinkedIn — page views are a total only; LinkedIn doesn't publish a breakdown. It counts unique people who reached your page organically, which is a different thing from followers. Post count isn't split either — it's Planable's own count, not a LinkedIn metric.
- TikTok — the Content table carries the breakdown for boosted posts; the post modal doesn't.
Cross-channel Analytics
Cross-channel Analytics gives you a bird's-eye view of your performance across every connected platform from a single dashboard — overall audience engagement, reach, and how your content is doing across your whole social presence.
Navigate to the Analytics section in the left sidebar.
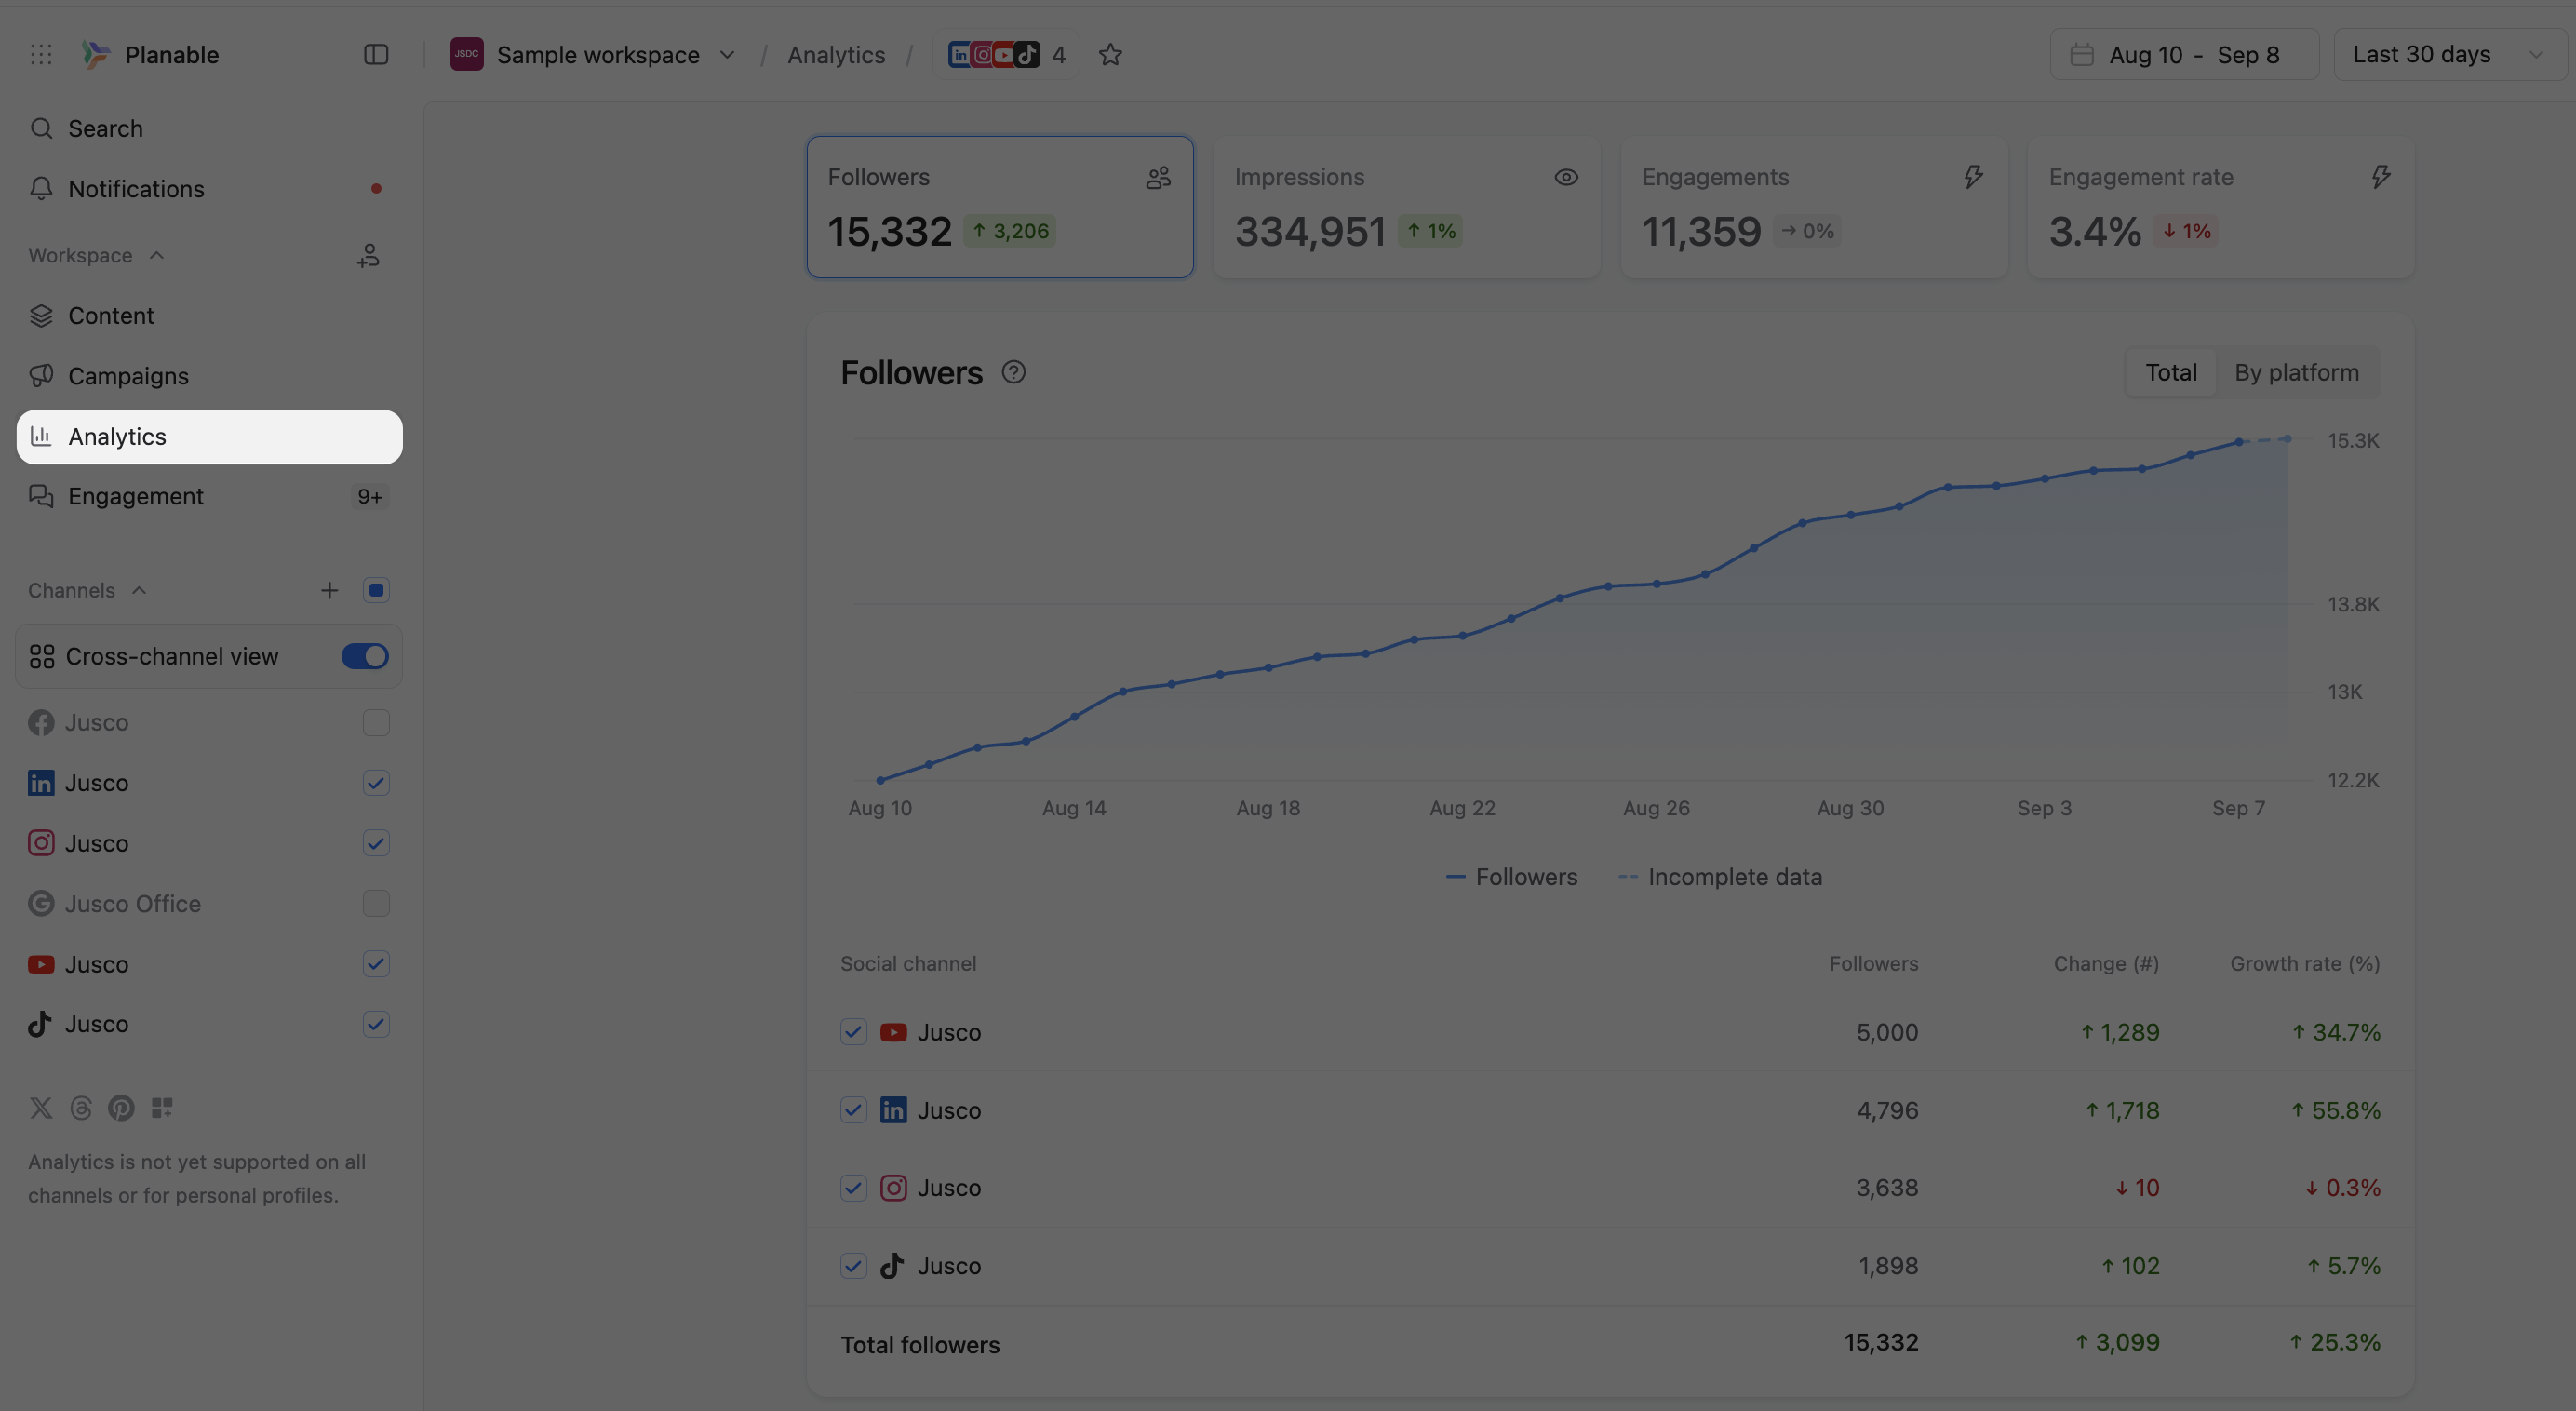
Then look for the Cross-channel view toggle and make sure it's turned ON (blue). From there you can select all pages or pick specific ones.
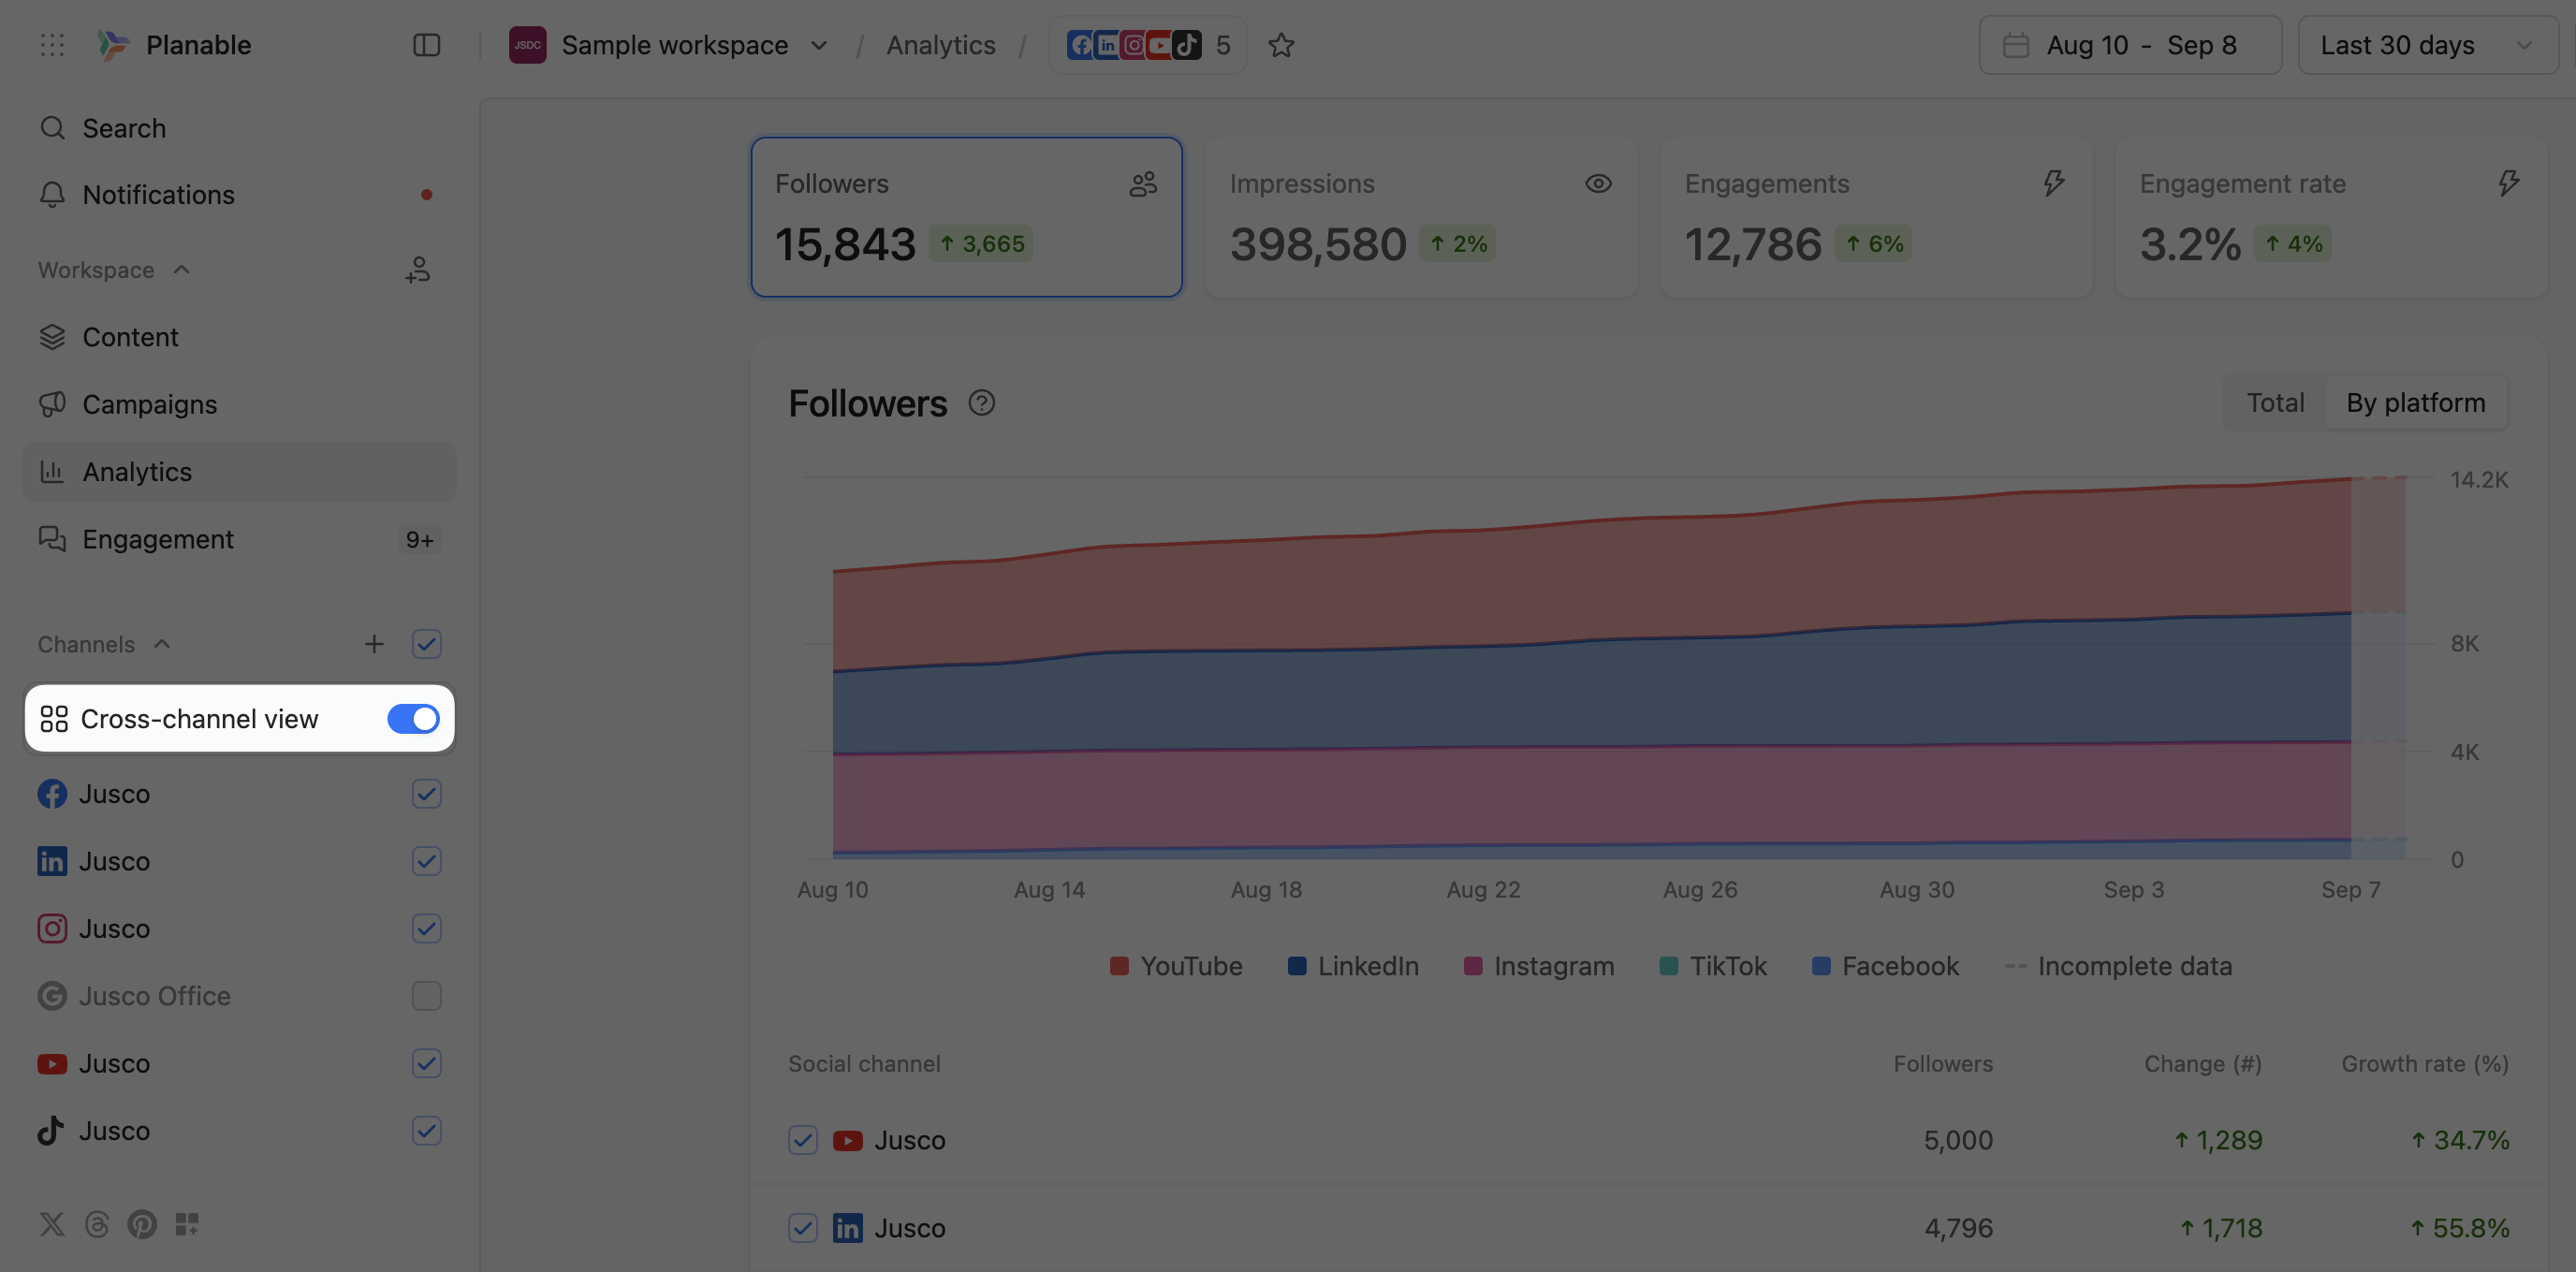
Good to know: cross-channel numbers are blended. There's no Both / Organic / Paid toggle here, no Ad spend card and no Ads table, and cross-channel reports don't offer the Data breakdown option. Switch to a single page for any of that.
Cross-channel metrics breakdown
Your cross-channel dashboard displays key metrics at the top:
- Followers — total follower count across all connected channels.
- Impressions — total number of times your content was displayed.
- Number of posts — total posts published across all connected platforms.
- Engagements — total interactions like likes, comments and shares.
- Engagement rate — percentage of engaged users vs. total reach.
Each metric shows both the current total and the percentage change from the previous period — green for growth, red for decline.
Switch between Total and By platform
See your complete aggregated performance, or drill into individual platform breakdowns.
- Total view — each metric (followers, impressions and so on) aggregated across all platforms.
- By platform view — performance for each platform separately, with detailed breakdowns.
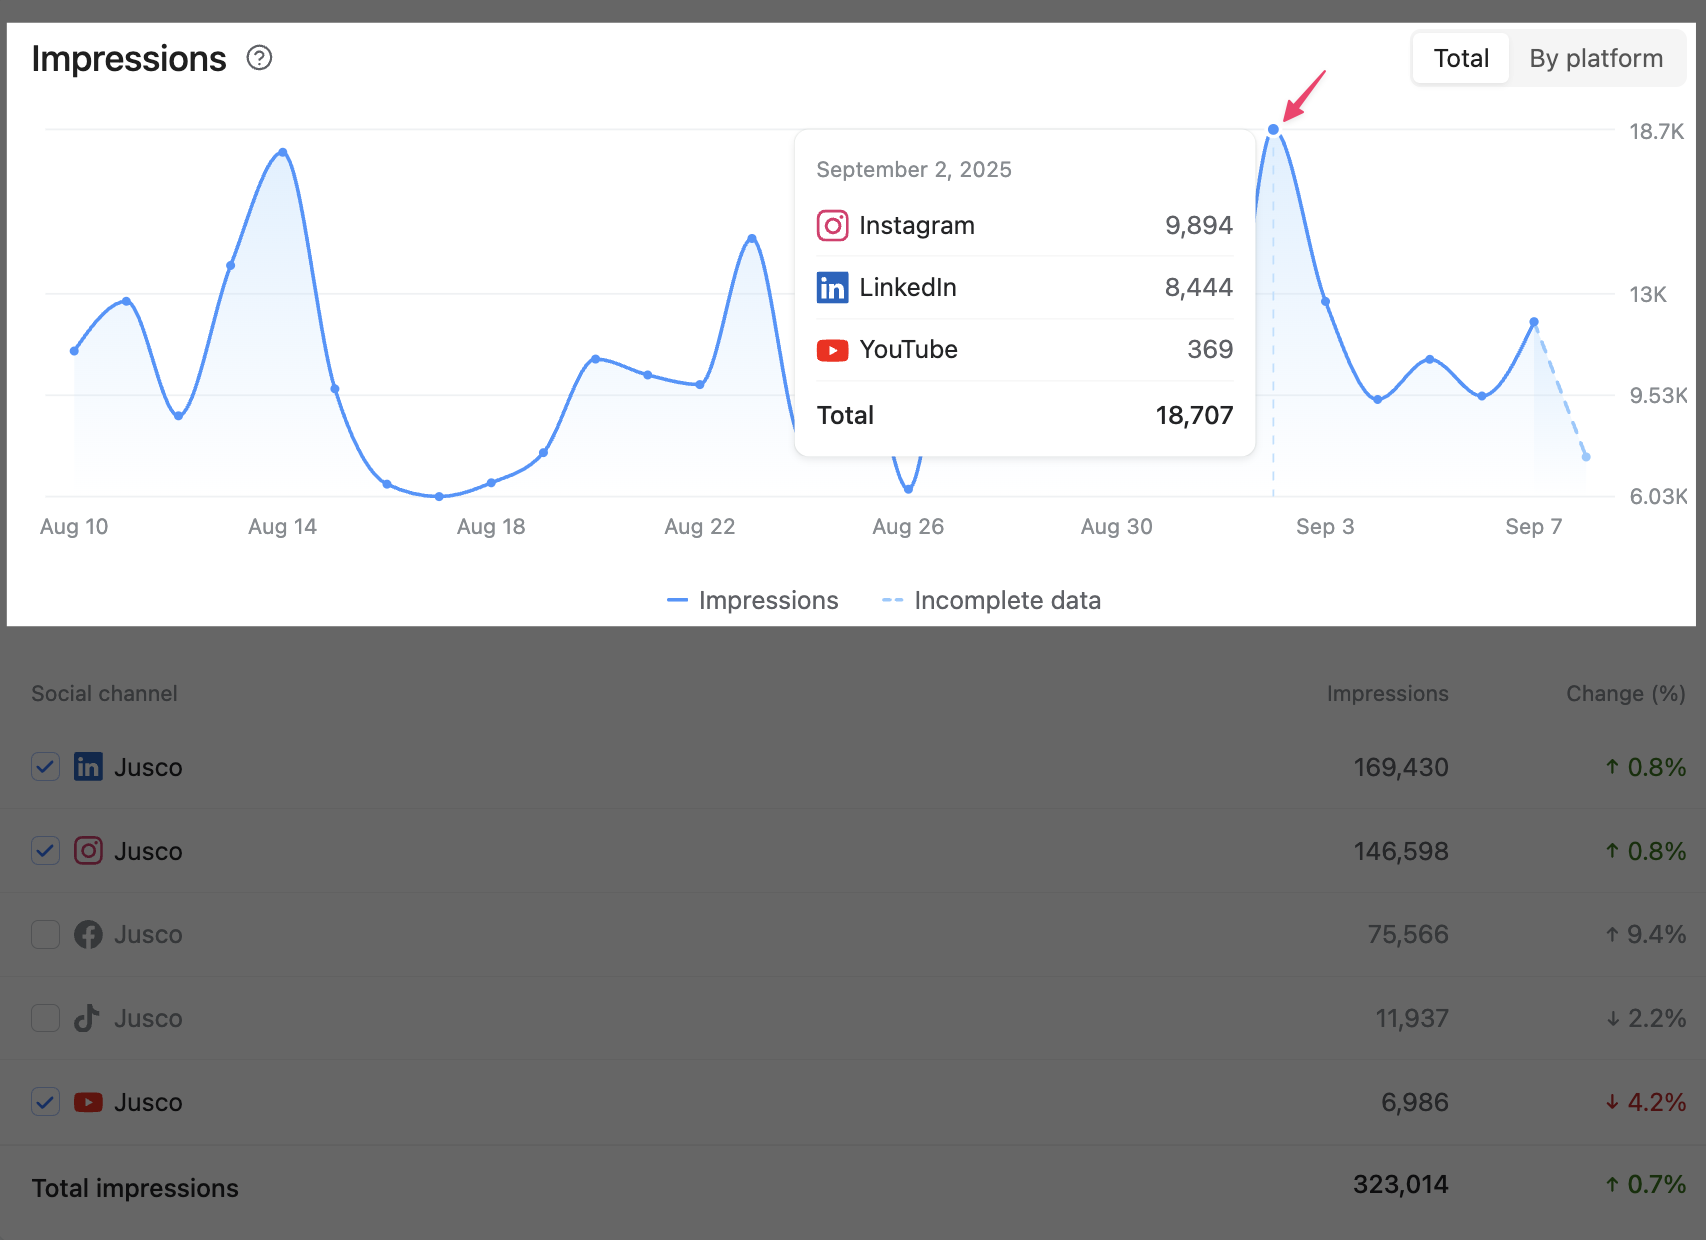
Use the checkboxes in the social channel breakdown table to include or exclude specific platforms, so you can focus on selected channels only.
X and Google Business Profile analytics are available in single-channel view only, and aren’t supported in cross-channel Analytics.
The main graph displays the selected metrics over the selected period — hover over any point to see the numbers for that date.
Top performing content
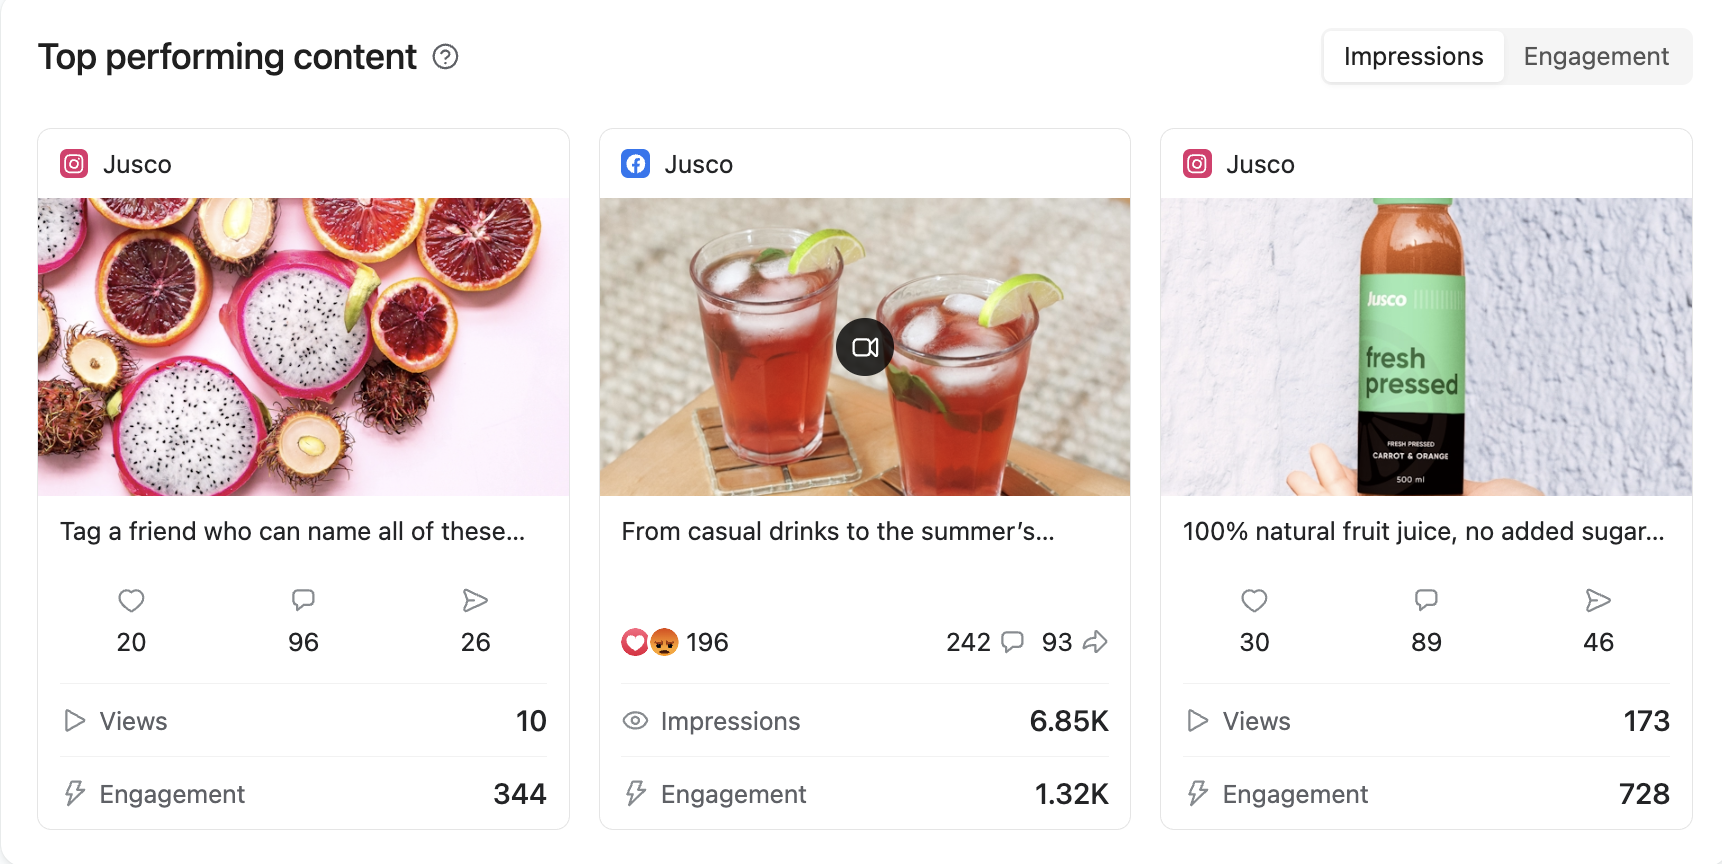
You also get visual previews of your three best-performing posts for the selected period, across all channels. Switch between the Impressions and Engagement filters to see different top performers.
Individual post analytics
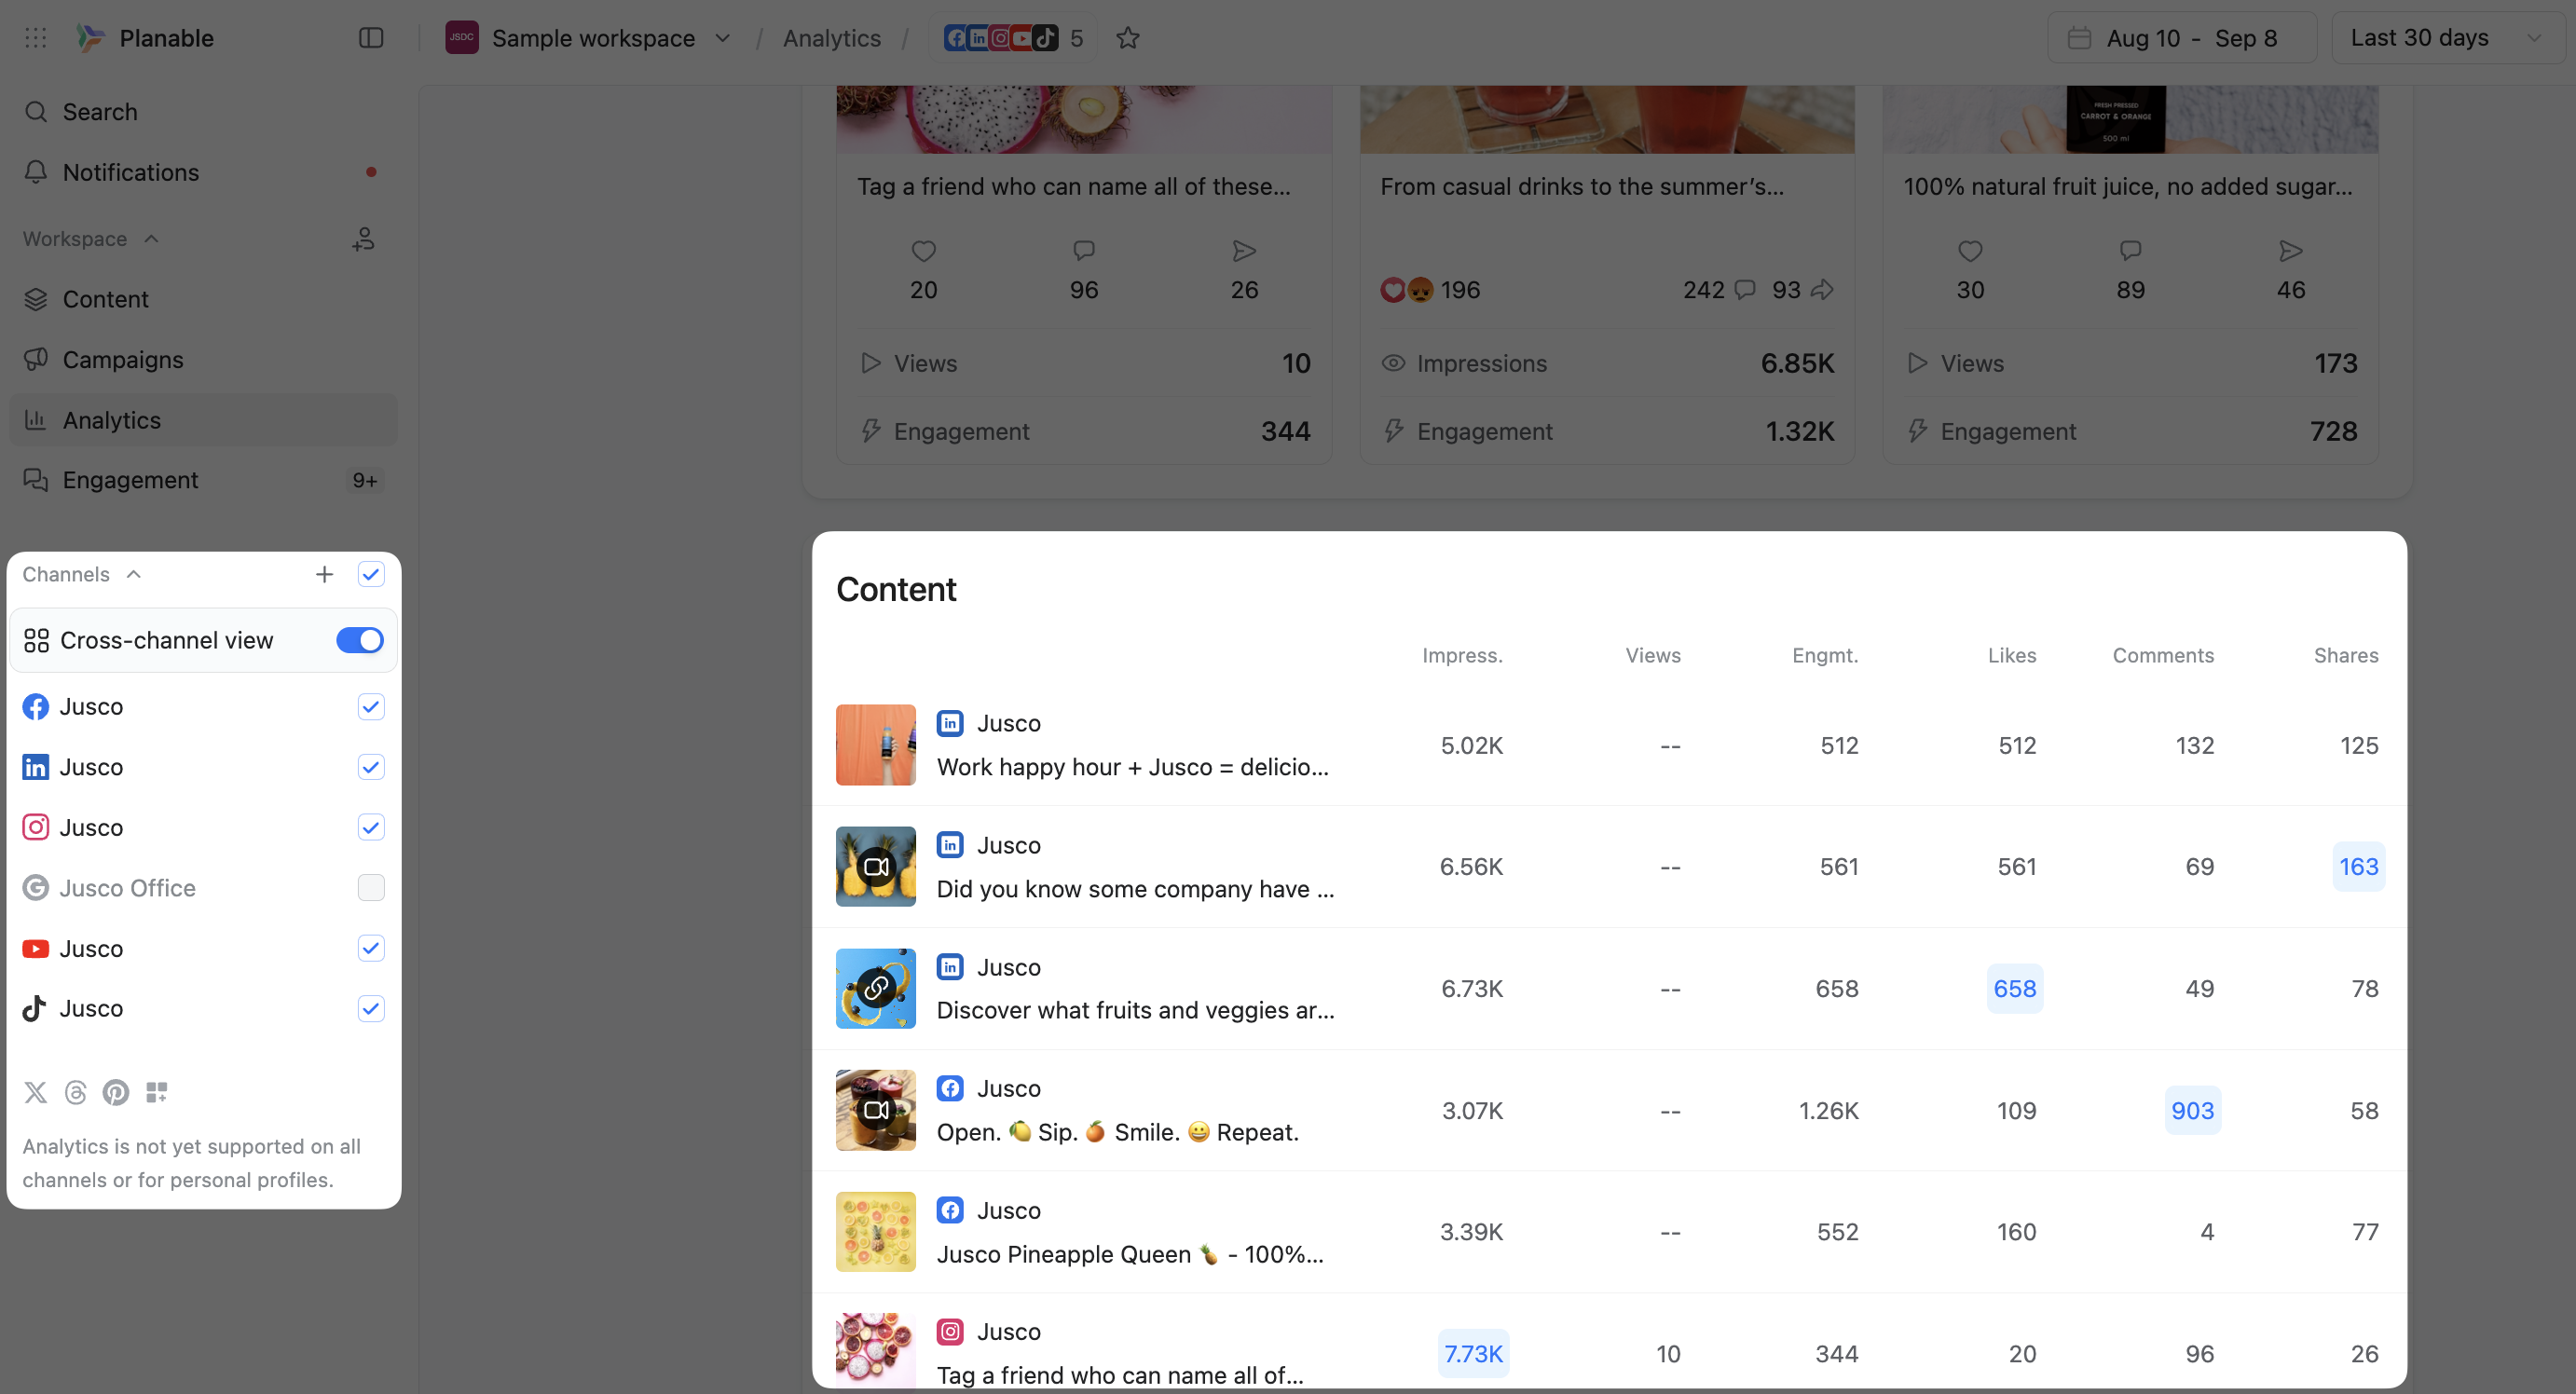
Cross-channel Analytics supports detailed insights for all your selected platforms. The Content section gives you a view of individual post performance across every connected channel — impressions, views, engagement, likes, comments and shares for each piece of content.
Single-channel Analytics
For platform-specific analysis, switch to single-channel view using the By platform toggle. This is also the only place the organic vs paid breakdown appears.
Metrics available per platform
Here's what you can track on each platform:
Facebook: followers, post counts, views, engagement and page views — plus ad spend, CPM, CPC and CTR once an ad account is connected.
Instagram: followers, post counts, reach, views, engagement and profile visits — plus ad spend, CPM, CPC and CTR.
LinkedIn: follower growth, post counts, impressions, reactions, comments, reposts, clicks, engagement, engagement rate, CTR and page views — plus spend, CPM, CPC and CPE.
TikTok: followers, post counts, video views, profile views and engagement — plus ad spend.
Google Business Profile: views split by desktop and mobile, searches, and website clicks.
YouTube: views, post counts, watch time and subscribers over time.
X (ex-Twitter): followers, post counts, impressions and engagements.
Date range selection
Adjust the timeframe from the dropdown menu to match your campaign durations.
Top performing content
View your three best-performing posts, filterable by impressions or engagement.
Content and Ads tables
The Content tab shows your own posts, with detailed metrics for each one. Promoted posts carry a Boosted tag and expand into From organic and From paid rows, so you can see which half of the result your budget paid for. Filter by content type (All, Posts, Reels) and download the data for reporting.
Below it, the Ads table lists advertised content that never went out on your page as a normal post. Those rows aren't clickable — there's no Planable post behind them.
Detailed post insights
Click any post in the Content table for a detailed breakdown of its performance. On boosted posts, how much of that breakdown is split organic vs paid depends on the platform — see the table above.
Audience Insights
Get a complete picture of who your followers are — their location, age and gender. Explore interactive maps, top countries and cities, and demographic breakdowns to better understand your audience.
It's available for Instagram professional accounts, LinkedIn company pages and TikTok Business accounts. For the full walkthrough, see Audience Insights.
Numbers that look odd but are correct
A few things in the organic vs paid view surprise people the first time. None of them is a bug:
Pro tip: comparing against Ads Manager or Campaign Manager? Use the same date range, check whether you're filtered to one ad account or all of them, and compare on data that's at least a few days old.
AI visibility
The AI Visibility block in Analytics gives you a quick read on how your domain is referenced by major AI engines, right next to your social performance metrics.
Setting it up
If your workspace doesn't have a website URL yet, you'll see a prompt to add one:
- Enter your domain (for example,
planable.io). - Click Connect.
Once your domain is set, the block updates with your AI visibility snapshot, powered by SE Ranking, our sister company. You can change the domain any time from your workspace settings.
The data
When your domain is connected, you'll see:
- Mentions — how often your brand is referenced in AI-generated answers.
- Link presence — how often your domain is cited as a source in those answers.
- AIO traffic — visits to your site coming from AI Overviews and similar AI-driven search experiences.
Metrics are shown for the previous full calendar month.
Competitor analytics
Benchmark your performance against competitors without leaving Planable. The Competitors tab lets you track up to 5 competitor profiles per page for Facebook Pages, Instagram professional accounts, YouTube channels, TikTok accounts and LinkedIn company pages — with a comparison table (followers, posting activity, average engagement), a follower-growth and engagement trend chart, each competitor's top posts, and CSV export.
Competitor data syncs daily.
Learn more in Competitor analytics.
Creating reports
You can build and download a report to share with clients or other stakeholders directly from Planable. Click Create Report in the top right corner.
From there you can customize:
- your logo
- which channels are included
- the reporting period
- the Data breakdown — Total, Organic or Paid — which sets what data the whole report is built from, plus a Report ad account dropdown to scope the paid figures
- whether metric descriptions and evolution are displayed
- which metrics are shown, and in which order
- a summary and detail section for each metric
The Data breakdown option is available for reports built on a single page, on Facebook, Instagram, LinkedIn and TikTok. Cross-channel reports show blended data.
Preview your report as you build it. When it's ready, share it through a public link, or download it as a PDF or CSV. The Content CSV includes your paid columns and advertised rows, with a Source column marking each row Organic or Advertised.
Good to know: a public share link follows the data breakdown you chose, not the viewer's. If you build a report on paid data and share the link, whoever holds it sees your ad spend — no Planable account needed. Worth a second look before you send one to a client.
For the step-by-step walkthrough, see Creating customizable reports in Planable Analytics.
Pricing
Planable Analytics is available as an add-on for your workspaces, at $14 USD per workspace per month or $140 USD per workspace per year. You can start with a 30-day free trial or pay on the spot.
The organic vs paid breakdown is included — everyone with access to Analytics has it, with no second add-on to buy.
See what your ad budget actually bought 👇
Don't have an account? Sign up, it's free →